
Austin Housing Market Affordability Update: Price-to-Income Ratios Still Elevated in 2025
Published | Posted by Dan Price
Austin Housing Affordability Trends in 2025: How Much Further Could Home Prices Fall?
If you’re looking to understand where the Austin housing market might be headed next, don’t just look at mortgage rates or inventory levels—look at affordability metrics. As of July 2025, despite nearly two years of price softening, Austin homes remain significantly overvalued relative to historical norms. The data shows that we may not be done correcting yet. Let’s break it down.
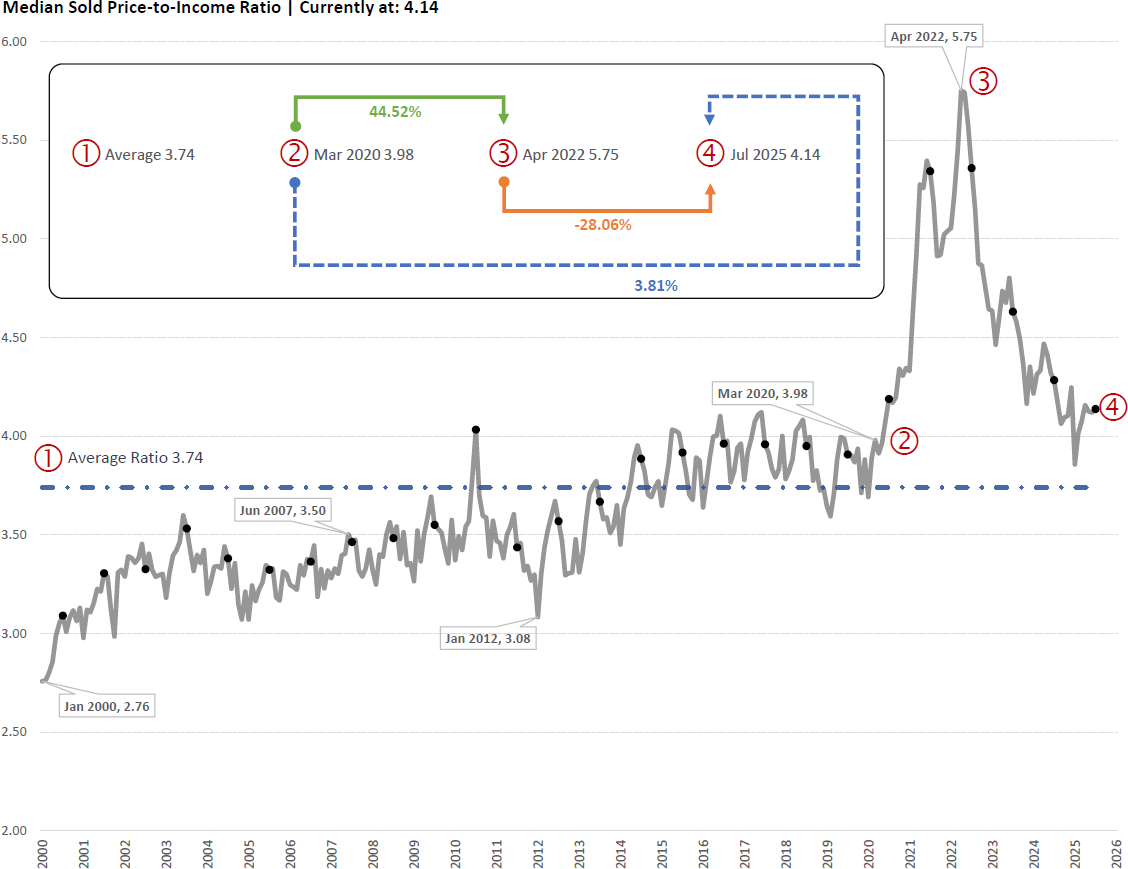
Price-to-Income Ratio: Still Above Long-Term Norms : The median price-to-income ratio for Austin-area homes currently sits at 4.14. This metric—comparing the median sold home price to the median household income—is one of the clearest gauges of local housing affordability. Historically, Austin’s market has hovered around a 3.85 ratio, based on data from 2000 to 2025. But in 2021–2022, that ratio exploded past 5.3, peaking in the second quarter of 2022 as home prices surged and mortgage rates remained suppressed. Despite a significant pullback since that peak, we’re still 7.5% above the historical average. That suggests prices may still be inflated compared to local earning power—even if it doesn’t feel that way in a post-pandemic, rate-hiked market.
Mortgage Burden: Affordability Still a Major Stress Point : The real-time affordability strain is more apparent when we zoom into monthly housing costs as a percentage of income. In July 2025, the average principal, interest, taxes, and insurance (PITI) payment on a median-priced home ($3,413/month) consumes 37.8% of the median household income. By most affordability standards—including Fannie Mae’s and the National Association of Realtors’ guidelines—anything above 30% is considered unaffordable. Austin hasn’t seen a PITI-to-income ratio this elevated since the peak of the 2022 housing bubble.
How Much Further Could Austin Prices Fall? If prices were to return to their historical price-to-income ratio of 3.85, and assuming no meaningful changes in income or interest rates, we estimate a 7% decline from today’s median price levels would be required. But history also shows that markets rarely correct with precision. They overshoot. If the market were to swing back toward a more conservative affordability level of 3.5, as seen during the 2012–2016 period, the implied downside in pricing could approach 15%.
Context Matters: Not Just About Prices : What’s unique about the current market is that interest rates remain near cycle highs, and the Federal Reserve is actively reducing its holdings of mortgage-backed securities—a reversal of the price-supporting policies we saw from 2009 through 2021. This structural shift removes a key prop for high prices and suggests that unless income growth accelerates or rates decline meaningfully, home prices will need to adjust further to restore true affordability.
A Measured Correction, Not a Crash : None of this implies a crash is imminent. The Austin market remains undersupplied in several key submarkets, particularly for entry-level homes. But the days of 20%+ annual appreciation are gone, and even modestly overvalued markets tend to revert to long-term affordability norms over time. Whether that reversion comes through lower prices, rising incomes, or falling interest rates remains to be seen—but today’s data suggests that pricing still has room to move down before Austin becomes broadly affordable again.
Final Takeaway : The market has already corrected significantly from its 2022 peak, but the current price-to-income ratio of 4.14 still points to elevated valuations. A further decline of 7% to 15% would bring the market back in line with historical affordability norms, barring rate cuts or wage growth. In a high-rate, slow-growth environment, price softening—not income gains—is the more likely path to affordability normalization.
Five Key FAQs About Austin Housing Affordability
1. What is the Price-to-Income Ratio and Why Does It Matter?
The price-to-income ratio compares the median home price to the median household income. It serves as a long-term benchmark of affordability. Historically, Austin’s ratio has averaged around 3.85. In 2022, it exceeded 5.3, signaling that homes were increasingly out of reach for the typical buyer. When this ratio is elevated, it suggests that home prices are rising faster than wages—a key sign of market imbalance.
2. How Much Should Austin Home Prices Fall to Reach Historical Norms?
To revert from the current ratio of 4.14 back to the historical average of 3.85, prices would need to fall by about 7%. However, if the market overshoots and reverts to the 3.5 level seen in past cycles, the drop could be closer to 15%. These figures assume income and interest rates remain steady.
3. What Role Do Mortgage Rates Play in Affordability?
A massive one. At today’s average rate of 6.7%, buyers face monthly payments that consume nearly 38% of their income. In contrast, a rate of 3.5%—common in 2020—would have resulted in a significantly lower monthly cost. Without rate relief, home prices must adjust to restore affordability unless wage growth accelerates.
4. Is Austin Still Experiencing a Housing Bubble?
Not in the traditional sense. Unlike 2021–2022, when rampant investor activity and artificially low rates fueled unsustainable gains, today's market is being held aloft by low inventory. That said, affordability metrics remain stretched, suggesting that values are still elevated relative to fundamentals, particularly local incomes.
5. What Should Buyers Do in This Market?
Buyers should be cautious but not paralyzed. If you're purchasing a primary residence with long-term intent, today’s market may offer opportunities—especially with seller concessions and builder incentives. But if you're stretching financially or betting on quick appreciation, this may not be the cycle for aggressive buying. Affordability data suggests more softening could be ahead.
Request Info
Have a question about this article or want to learn more?
